01 Before you risk anything
Five things decide whether what you get resembles what is published. None of them is in the settings, and all of them have cost people money in products like this one.
1. Following the alerts is not running the strategy. With simple mode off, most of what this does is resize an existing position, not reverse it. In one 15-month sample there were 295 closed trades and only 57 direction changes. And stretches of months where the size moved repeatedly while direction never changed. Alerts fire on the 57. If you trade only the alerts you are running something the figures on this site do not describe.
Simple mode is the honest answer to this. It has four signals and a fixed size, so what you can follow by hand and what was measured are the same thing. It returns more and draws down nearly twice as deep. That is the trade.
2. Half the record depends on being able to short. Shorting BTC needs a margin or futures account. On spot you can only take the long half, and that is a different result: Sharpe 1.23 and CAGR 17.6%, against 1.31 and 20.3% with shorts at half size. If you cannot short, expect the first pair, not the second.
3. Max exposure above 1.0 is borrowed money and nothing here models it. No margin interest, no funding rate, no liquidation. The backtest cannot show you the one event that matters most with leverage, which is being closed out at the worst moment by someone else. 1.0 means no leverage. Above it, the published figures stop applying in a way that is not recoverable by scaling.
4. The drawdown number understates the experience by a long way. Maximum drawdown is −14.5%, which sounds survivable. What that number does not say: the longest stretch below a previous high was 713 days, from November 2021 to October 2023. And across the whole record the account was underwater on 77% of all days.
Shallow but very long. Nobody is wiped out by this. People abandon it, usually near the bottom, and that is how a working system loses someone money.
5. Nine years is eight independent observations, and three of them were flat. The twelve-month returns were: 0%, +31%, +6%, +81%, 0%, +1%, +45%, +30%. Two years carry the average. A year at +9% is an ordinary year for this system, not a failure of it. The 95% confidence interval on the mean twelve-month return runs from +0.4% to +48.3%.
And one thing about the window itself. One asset, one nine-year stretch containing three large bull markets and Bitcoin’s entire institutional adoption arc. That regime happened once. Forward results will be worse than the backtest. This is not a hedge in the writing. It is what the record can and cannot support.
02 What the numbers mean, and what they do not
Every figure published for LATENT is a backtest on daily bars, BINANCE:BTCUSDT, with commission at 0.045% a side. There is no live track record and the site says so wherever a figure appears.
| Figure | Value | What it is worth |
|---|---|---|
| Sharpe | 1.31 | Standard error 0.34, so the 95% interval runs 0.65 to 1.97. The point estimate is the least interesting part of that range. |
| CAGR | 20.3% | Excluding 2020–2021 entirely: 15.5%. From 2022 onward only: 17.8%. |
| Max drawdown | −14.5% | See above. 713 days was the long one, 77% of days underwater. |
| Deflated Sharpe | 0.78 | The probability the edge is real after accounting for 730 configurations having been tried. Below 1.0 by design; this is the honest number, not the flattering one. |
| Beta to BTC | 0.07 | Rolling one-year range −0.13 to +0.36. Alpha 15.8% a year. |
What was tested and thrown away, since it says more than what was kept. ATR stops at 2.4x cost 0.18 Sharpe. Stops with take-profits cost 0.31. A time stop cost 0.25. A 29-feature logistic model under purged walk-forward validation scored negative 0.15, worse than doing nothing. None of it is in the product, and that is why there are no stop-loss settings to configure.
Costs that are modelled and costs that are not. Commission at 0.045% a side is charged throughout. Slippage, spread, partial fills and funding on short positions are not. Orders fill at bar close. Your exchange fees may be higher than 0.045%, and every one of those omissions works against you rather than for you.
Intraday is not the same product. The signal holds up on faster charts; the toll does not. A 15-month 1H run turned over 46× capital a year and paid 18% of gross profit in commission. Everything published here is a daily-bar measurement, and the panel on the chart says so on any other timeframe.
03 Getting access
- Buy a membershipAny of the three terms. Checkout asks for your TradingView username.
- Give the exact usernameTradingView usernames are case-sensitive. A near match cannot be granted, so a misspelling is the one thing that delays access.
- Wait for the grantAccess is added by hand, usually within 12 hours.
- Open TradingViewThe script appears under Indicators → Invite-only scripts. If it is not there, sign out and back in once.
Nothing is downloaded and there is no file to install. The script runs inside your own TradingView session, which is also why your chart data, settings and results never reach us.
04 Putting it on a chart
- Set the symbol to BINANCE:BTCUSDTEvery published figure is measured on this feed. Another exchange’s BTC or the BTCUSD index has different closes and will give different numbers.
- Choose a supported timeframe1H, 2H, 4H, 6H, 8H, 12H, 1D or 1W. Not 15-minute or 30-minute. That is a TradingView bar limit, not a setting.
- Load enough historyOn intraday timeframes it needs roughly 425 days of bars before a first signal. Scroll left until the chart is fully loaded if nothing appears.
- Add the indicatorIndicators → Invite-only scripts → LATENT.
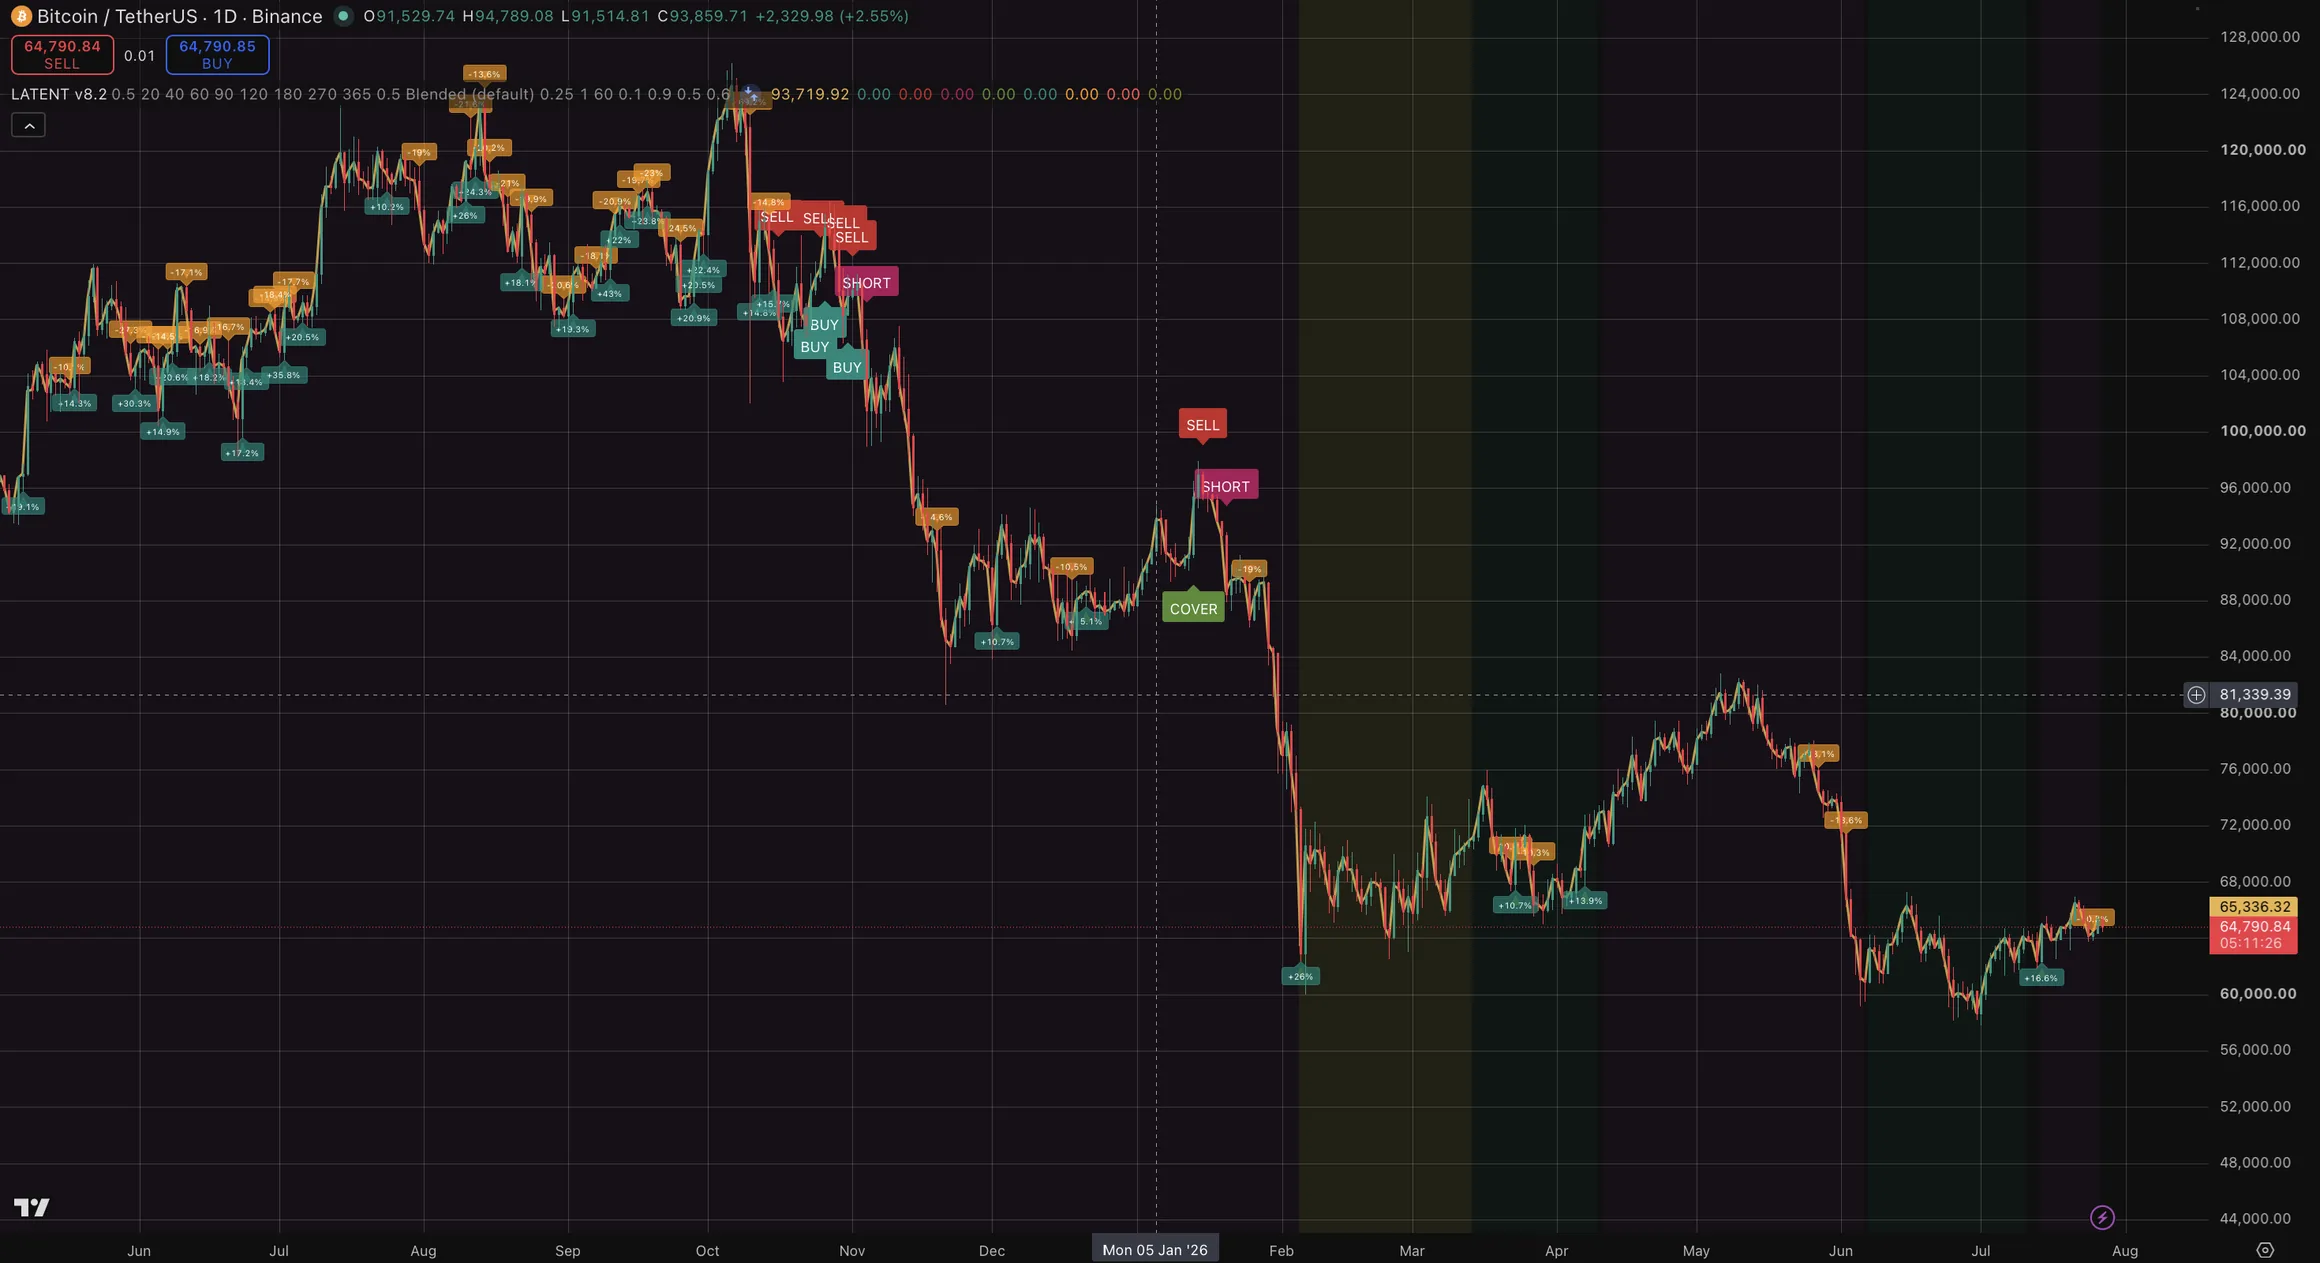
05 Reading what it prints
On the chart
| What you see | What it is |
|---|---|
| Gold line | The Kalman trend, the filter’s estimate of where price is, with the bar-to-bar noise taken out. It is not a moving average and it is not a signal. |
| Teal background | The regime model reads directional. Context only. |
| Purple background | The regime model reads range-bound. Context only. |
| No shading | Neither state is above the confidence threshold. The model is undecided. |
| Orange background | The volatility circuit breaker has fired. Realised volatility is in its top decile and position size is halved. |
| Red background | The timeframe is not supported. Nothing is being calculated. |
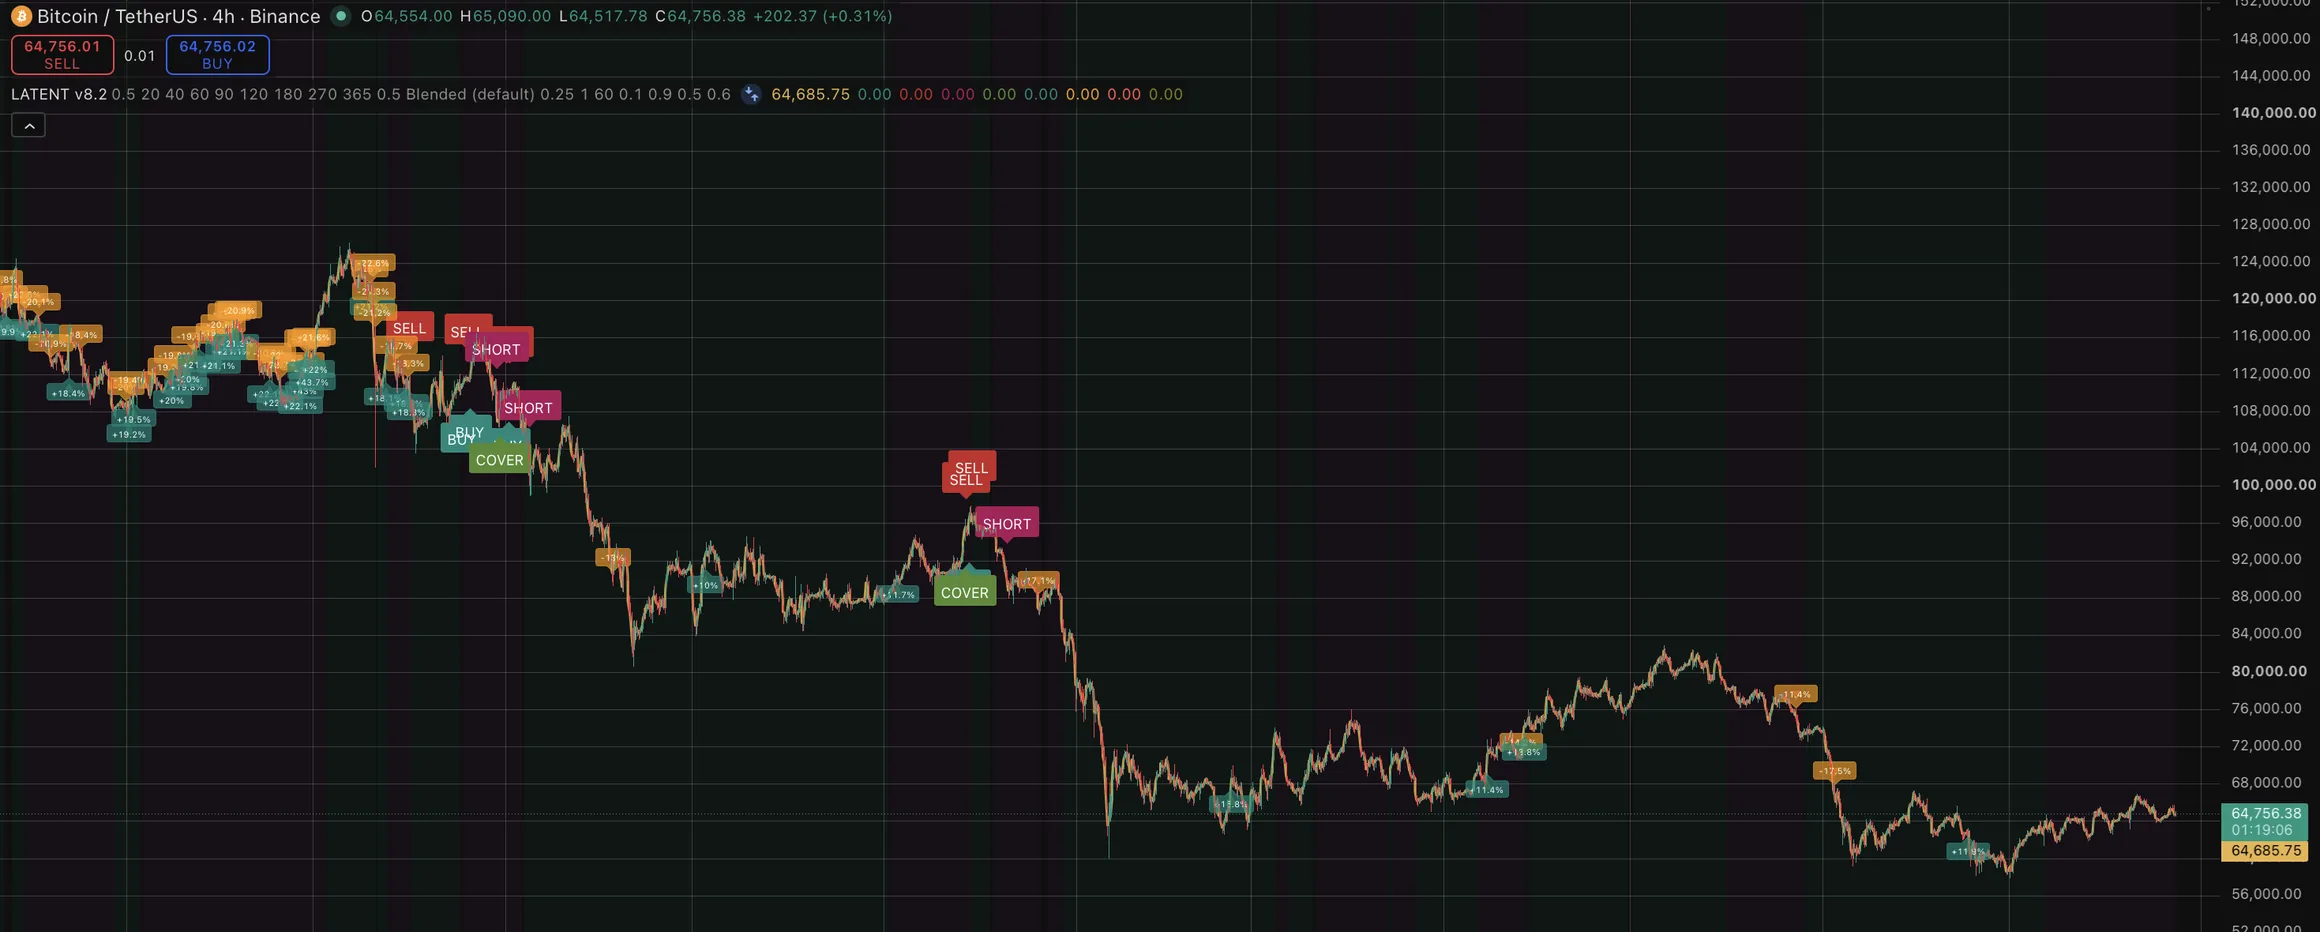
| BUY / SELL / SHORT / COVER | A change of direction. These are the only four events that reverse the book. |
| Small triangles, and +12% / −7% labels | Resizes. The position got bigger or smaller without changing side. |
| Label on the last bar | What the strategy would do right now, the position it is holding, and the regime reading. |
Most of what this strategy does is resize, not reverse. With simple mode off, one 15-month sample produced 295 closed trades and only 57 direction changes. The other 238 were the position being trimmed or added to. There were stretches of months with no direction change at all while the size moved repeatedly.
That is why the resize markers exist and why they default to on. Without them a working strategy looks like an idle one.
The panel, row by row
| Row | What it tells you |
|---|---|
| DO THIS | BUY NOW, SELL NOW, SHORT NOW, COVER NOW, HOLD LONG, HOLD SHORT or STAY IN CASH. The first four appear only on the bar a direction changes. |
| position | LONG, SHORT or FLAT, and what percentage of capital is committed. |
| momentum vote | The eight lookbacks, as a count out of eight. A 4–4 split means no directional edge and no position. |
| Kalman slope | The filter’s estimate of drift per bar. This is the only input the regime model reads. |
| GARCH vol / blended vol | Both estimates, annualised, shown side by side whichever one is driving sizing. Comparing them tells you how much the choice is currently worth. |
| breaker lookback | How much history the circuit breaker is ranking against, in days. Pine caps derived series at 4,000 bars, so on 1H this is roughly 167 days rather than a year, the panel reports the real figure rather than the intended one. |
| HMM regime / P(directional) | The state and the model’s confidence in it. Context, not instruction. |
| sizing model | Which volatility model is actually driving size. With simple mode on this has no effect. |
| equity / drawdown now | Simulated account value and how far below its own high-water mark it currently sits. |
| signals / resizes | Direction changes against resizes. If the first number is small and the second is large, the chart is quiet because the strategy is adjusting rather than reversing. |
| fees paid | Cumulative commission at 0.045% a side. Worth watching: on a 15-month 1H run it reached 18% of gross profit. |
| 9yr backtest | The published Sharpe and drawdown for the mode you are in. On any timeframe other than daily the next row says so, because these are daily-bar measurements and printing them beside live intraday numbers would otherwise read as a claim about what is on screen. |
When it says nothing is happening
| Message | Meaning |
|---|---|
| warming up: need N bars | The longest lookback is 365 days and the volatility window is another 60, so roughly 425 days of history must load before a first signal. Scroll left until the chart is fully loaded. |
| lookbacks split 4–4 | The vote is tied. No position is the correct answer, not a failure. |
| inside rebalance band | The target moved, but not far enough to be worth paying commission for. |
| long / short signal blocked | You have turned that direction off in the settings. |
| TIMEFRAME NOT SUPPORTED | A 365-day lookback needs 35,040 bars at 15 minutes and Pine caps the buffer at 10,000. Not a fault and not fixable, use 1H or slower. |
06 The settings
Every figure on this page is measured on daily bars, over the nine-year window, with everything else left at its default. Change a setting and the published numbers stop describing what is on your screen. That is not a warning against changing them, only against changing them and still expecting the site’s figures.
Mode. The one that changes everything else
| Setting | Default | What it does |
|---|---|---|
| Simple mode | off | Off, each position is sized by the volatility estimate: small when the market is turbulent, larger when it is calm. On, every position is the same fixed fraction of your equity and only the direction changes. |
| Position size (simple mode) | 0.50 | Only read when simple mode is on. The fraction of equity committed to every trade. |
Simple mode on means the volatility model is never consulted. Sizing is fixed, so the Blended and GARCH options make no difference whatsoever, the two produce identical trades, identical results, identical everything. The volatility model only matters with simple mode off.
So the two switches do not give four combinations. They give three.
The three behaviours
| Setting | CAGR | Sharpe | Max drawdown |
|---|---|---|---|
| Simple mode off, Blended, the default | 20.3% | 1.31 | −14.5% |
| Simple mode off, GARCH(1,1) | 14.7% | 1.12 | −18.7% |
| Simple mode on, either model, at 0.50 size | 33.2% | 1.10 | −26.6% |
Simple mode returns more and hurts more. It is not a worse setting, it is a different trade: a bigger number at the cost of a drawdown nearly twice as deep, and a lower Sharpe means you are being paid less for carrying it. The default survives better.
GARCH is offered because it is the fitted model, not because it tested better. It did not.
Volatility and sizing, only with simple mode off
| Setting | Default | What changing it does |
|---|---|---|
| Position sizing driven by | Blended | Blended 20.3% CAGR at Sharpe 1.31; GARCH 14.7% at 1.12. |
| Target volatility | 0.25 | The volatility of a full-conviction position. 0.10 → 7.6% CAGR, −6.9% drawdown. 0.15 → 13.0%, −9.4%. 0.25 → 20.3%, −14.5%. 0.40 → 33.8%, −22.1%. 0.80 → 47.4%, −38.6%. |
| Max exposure | 1.0 | 1.0 is no leverage. Above it you are borrowing, and neither margin cost nor liquidation risk is modelled anywhere in these figures. |
| Blended vol window | 60 days | How far back the blended estimate looks. |
| Rebalance band | 0.10 | How far the target may drift before it trades. Most orders are resizes, not reversals, so raising this trades less often at the cost of tracking the target less closely. |
| Volatility circuit breaker | on | Halves position size when realised volatility is in its top decile. Removing it measures 1.26 against 1.31, not statistically significant, kept on risk-management grounds. |
Target volatility is the dial people reach for, and it is worth understanding what it does not do. Across the whole range from 0.10 to 0.80, Sharpe stays between 1.24 and 1.39 while CAGR goes from 7.6% to 47.4% and drawdown from −6.9% to −38.6%.
That flat Sharpe is the point. The dial buys return with drawdown, not with edge. Turning it up does not make the system better at reading the market; it makes the same reading bigger in both directions.
Direction
| Setting | Default | What changing it does |
|---|---|---|
| Allow longs / Allow shorts | both on | Long-only measures Sharpe 1.23 and CAGR 17.6%, against 1.31 and 20.3% with shorts included. |
| Short size multiplier | 0.5 | Shorts are taken at half size. That tested best risk-adjusted, but the short side rests on only three bear markets, 2018, 2022, 2026. And in a falling market it is the half-size book that is working. |
Signal lookbacks
Eight momentum lookbacks in days, 20, 40, 60, 90, 120, 180, 270, 365, each voting on direction. The signal is the vote, and the panel shows it as a count out of eight. A 4–4 split means no directional edge and no position.
These were fitted, and the entire published record depends on them. Changing one makes every figure on this site inapplicable to what you are running.
Display
The Kalman line, the regime shading, the marker set and the panel are all display-only. Turning any of them off changes nothing about the trades.
One worth leaving on: ADD / TRIM markers. With simple mode off, most of what the strategy does is resize rather than reverse, in one 15-month sample, 295 closed trades produced only 57 direction changes. With resize markers hidden, the chart looks idle while the strategy is working.
07 The regime gate
A two-state hidden Markov model runs alongside the signal and marks which regime the market appears to be in. It is drawn on the chart as context. It does not filter the signals.
That surprises people, so here is why. The obvious thing to do with a regime model is to use it as a gate, take signals in one state, sit out the other. That was tested. In every configuration tried, gating the signals on the regime reduced risk-adjusted return rather than improving it. The gate was cutting trades that would have been profitable more often than it was avoiding losses.
Two honest options followed: remove the model, or ship it as what it demonstrably is. It stayed, because knowing which regime the model reads is useful information for a person looking at a chart, even when acting on it mechanically is not.
So: read the regime as description, not instruction. It tells you what the model currently thinks the market looks like. It is not telling you to trade or to wait, and the published figures were not produced by filtering on it.
The cost was 0.30 to 0.39 Sharpe in every combination tested. And the two fitted states are not what people assume: they resolved as directional against range-bound, not bull against bear. A range-bound reading is not a warning that price is about to fall.
08 Alerts
Six alert conditions are available through TradingView's own alert dialog. Four are direction changes and two are regime changes.
| Alert | Fires when |
|---|---|
| BUY | A long is opened, hold until SELL |
| SELL | A long is closed |
| SHORT | A short is opened, hold until COVER |
| COVER | A short is closed |
| REGIME DIRECTIONAL | The regime model crosses its threshold into directional |
| REGIME RANGE-BOUND | The regime model crosses into range-bound |
The four trade alerts fire on direction changes only. With simple mode off, most of what the strategy does is resize, and no alert fires for a resize. Following alerts alone therefore does not reproduce the backtested behaviour, which adjusts size continuously.
The two regime alerts are context. They are not instructions to trade, and gating trades on them tested worse than ignoring them.
We do not send signals by email, Telegram or anywhere else. The indicator is the product; there is no signal service. Anyone offering one in our name is not us.
09 What it does not do
- It does not place orders. There is no broker connection and no automation.
- It does not size positions. How much to risk is your decision and the site will not advise on it.
- It does not predict price. It describes what the model reads in the bars that have already closed.
- It has no live track record. Every figure published for it is a backtest, and that is stated wherever a figure appears.
- It does not repaint. Signals are computed on closed bars and do not move once printed.
- It does not know your account. Every figure assumes the whole simulated balance is in this one strategy on this one asset. What fraction of your own money belongs here is a decision only you can make, and we are not registered to help you make it.
- It does not stop you out. There are no stop-loss settings because every stop tested made results worse. If you want one, you are adding something that was measured and rejected. Which is your right, but the published figures will no longer describe what you are running.
When to stop using it. Not after a losing month, and not after a flat year, three of the eight years in the record were under 2%. The reasons that would actually matter: your fills are consistently worse than the model assumes, you find you cannot sit through a drawdown that lasts into a second year, or you are trading a size that makes you check the chart at night. The first is a cost problem, the other two are the wrong size, and none of them are fixed by changing a setting.
10 Practising without money
The paper trading simulator runs on live BTC/USDT prices with a simulated balance. It draws no signals and gives no advice. It is there to let you feel what a position size does to a balance before any of it costs you anything.
Optional: a short worked example running the indicator and the simulator side by side. Only worth adding if it can be done without implying the simulator is showing indicator signals, which it is not.
11 When something looks wrong
| What you see | Almost always |
|---|---|
| Nothing is printed | Not enough history loaded, or an unsupported timeframe |
| The script is not in the list | Access not granted yet, or a misspelled username at checkout |
| Numbers differ from the site | A different symbol, or a setting changed from its default |
| An error on a 15-minute chart | Expected. The lookback needs more bars than TradingView will give at that timeframe |
Anything else, email tilekarganesh662@gmail.com with your TradingView username, the symbol and timeframe, and a screenshot including the settings panel. The contact page lists what makes a fault report quick to answer.